
By Linda Welzenbach Fries
When the Earth moves, it makes a sequence of waves that pass through the crust, rattling sensitive seismic stations miles away from the movement source. For over a century, the core mission of seismology has been deceptively simple, listen to these ground vibrations, pinpoint where and when the earthquake occurred, and untangle which wave belonged to which event.
Sounds simple, but as seismic networks have expanded and artificial intelligence has begun listening to the Earth with enhanced sensitivity, seismologists have run into a paradoxical dilemma; they now have far too much data for traditional methods to handle.
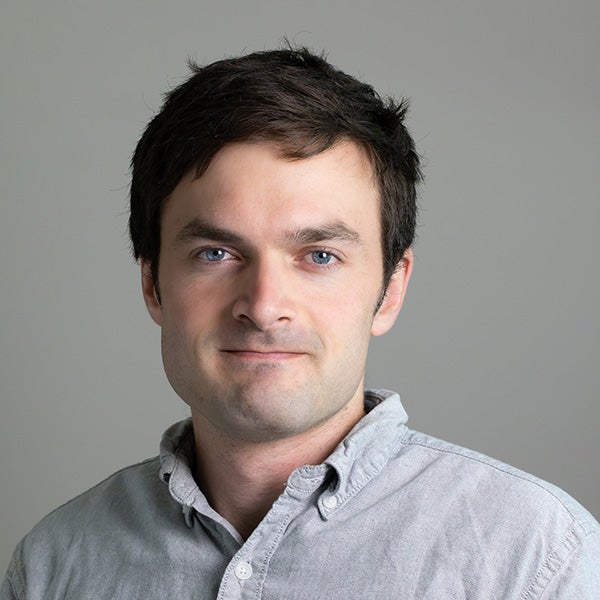
Department of Earth, Environmental and Planetary Sciences (EEPS) newest faculty Ian McBrearty brings a novel solution to this problem. By bridging advanced artificial intelligence with graph theory — mathematical structures used to model connections or interactions between paired objects — McBrearty has developed a deep-learning system known as GENIE (Graph Earthquake Neural Interpretation Engine). GENIE’s graph neural networks untangle seismic data to reveal microearthquakes previously hidden.
"Traditional methods treat seismic data like a rigid grid, but the Earth doesn’t work on a grid," said McBrearty, an EEPS assistant professor. "Graph neural networks allow us to model the dynamic, irregular geometry of seismic networks exactly as they exist in nature."
A journey rooted in math and geology
McBrearty’s path to pioneering graph neural networks in seismology began when he was an undergraduate at Iowa State University, where he pursued a double major in geology and mathematics. While he loved studying the Earth, he found himself drawn to mathematical algorithms and data science tools.
His first deep dive into real-world seismic data occurred during his master’s degree studies at the University of Wisconsin-Madison, where he analyzed continuous full-waveform recordings from glaciers in Greenland.
Differentiating between glacial tremors, water migration and crevasse fractures across noisy signals proved to be complex.
“I was looking at single seismic traces from a glacier seismology project in Greenland. The full waveforms were super complicated because you get lots of little earthquake signals. You get what's called glacial tremor, fluid flow and the crevassing events. I was sitting there losing my mind, asking how I tell the difference between all of these,” McBrearty recalled.
To make sense of the chaos, McBrearty began experimenting with early data science that applied unsupervised machine learning methods to organize unlabeled datasets into groups called clusters.
“Eventually we found that the waveform signature of all the distinct events we grouped into clusters were also superimposed together to create the glacier tremor, which represented continuous slip at the bed of the glacier,” McBrearty said.
During a summer internship with the U.S. Geological Survey, McBrearty was assigned to construct a comprehensive earthquake catalog for northern Chile.
Traditional cataloging methods relied heavily on manual rules or back-projection stacking techniques, methods that frequently produced high rates of false positives and poorly constrained earthquake locations. So, McBrearty went back to the math.
"I realized mathematically that phase association was the hardest part of the problem," he said. "It’s fundamentally an optimization assignment task that appears across fields from astronomy to video tracking, but seismology was still using older, rule-based heuristics."
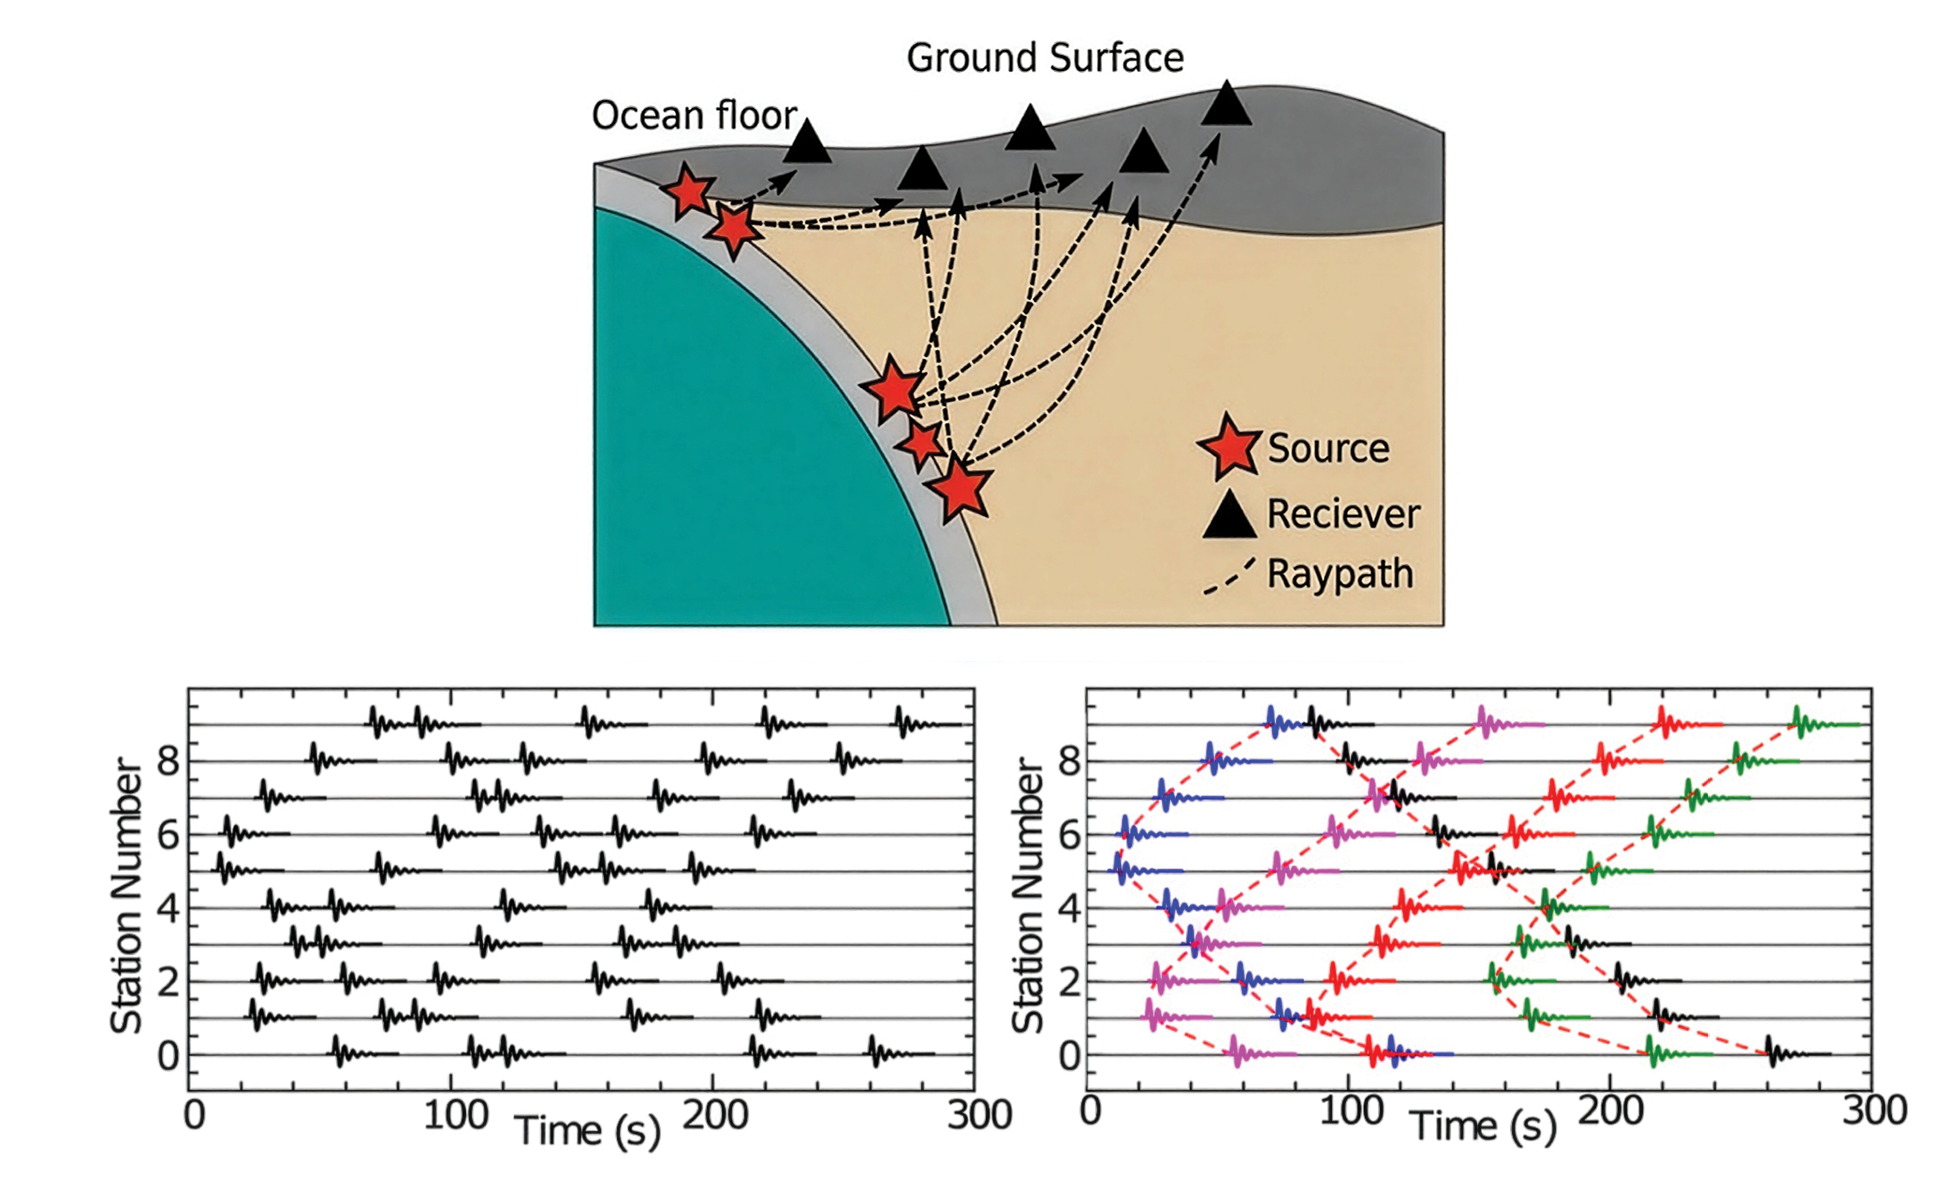
Determined to build a better tool, McBrearty designed an early graph-theory algorithm to process the Chilean data. He continued refining this method while working as a graduate student researcher at Los Alamos National Laboratory, successfully producing a detailed earthquake catalog. However, the technique required extensive manual parameter tuning and struggled when applied to large numbers of seismic stations.
When McBrearty began his Ph.D. at Stanford University under professor Gregory Beroza, his adviser tasked him with a much larger challenge: Build an enhanced earthquake catalog for Northern California. Moving from Chile’s roughly 25 stations to California’s approximately 1,000 irregular stations pushed his previous methods past their limits. Recognizing that emerging graph neural networks offered the ideal mathematical framework to handle complex sensor arrangements, McBrearty set out to create a fully trainable, deep-learning-based tool that could sort through the seismic sensor chaos to identify individual earthquakes.
Making sense of a 'big ball of wibbly-wobbly time'
To understand McBrearty’s breakthrough, one must first appreciate how earthquake monitoring has evolved over the past decade.
Historically, building an earthquake catalog required scientists or basic computer programs to scan wiggle lines on seismograms and mark "picks". Picks are the arrival times of primary, or fast, (P) and secondary, or slow, (S) waves. Once the wave picks were identified, an algorithm performed a phase association, matching up P and S arrivals across multiple sensors to group them by their common source earthquake.
In recent years, the rise of deep-learning pickers has transformed the field. The AI pickers rapidly spot subtle seismic arrivals that are routinely missed during manual scans, but the increase in picks creates a massive computational bottleneck.
Instead of fewer clean wave arrivals, seismic networks are now flooded with millions of pick detections per day. Small earthquakes occurring close together in time and space generate overlapping wave patterns — a phenomenon known as time entanglement, or what the TV show "Doctor Who" calls "wibbly-wobbly, timey-wimey,"[2] where events echo, loop or bind together.
Faced with this data tsunami, McBrearty recognized that standard machine learning tools were also missing the mark. Standard AI models are designed for predictable, uniform grids of data, like pixels in a digital photo. But seismic stations scattered across mountains, valleys and fault lines do not sit on a neat grid. Additionally, sensor quality varies, and sensors frequently go offline or come online.
McBrearty’s key insight was to treat both the physical stations and candidate earthquake source locations as interconnected graphs.
"Standard neural networks force unevenly scattered sensors into a rigid grid. With graph neural networks, the actual physical geometry of the sensors and spatial locations becomes the network's computational backbone," McBrearty said.
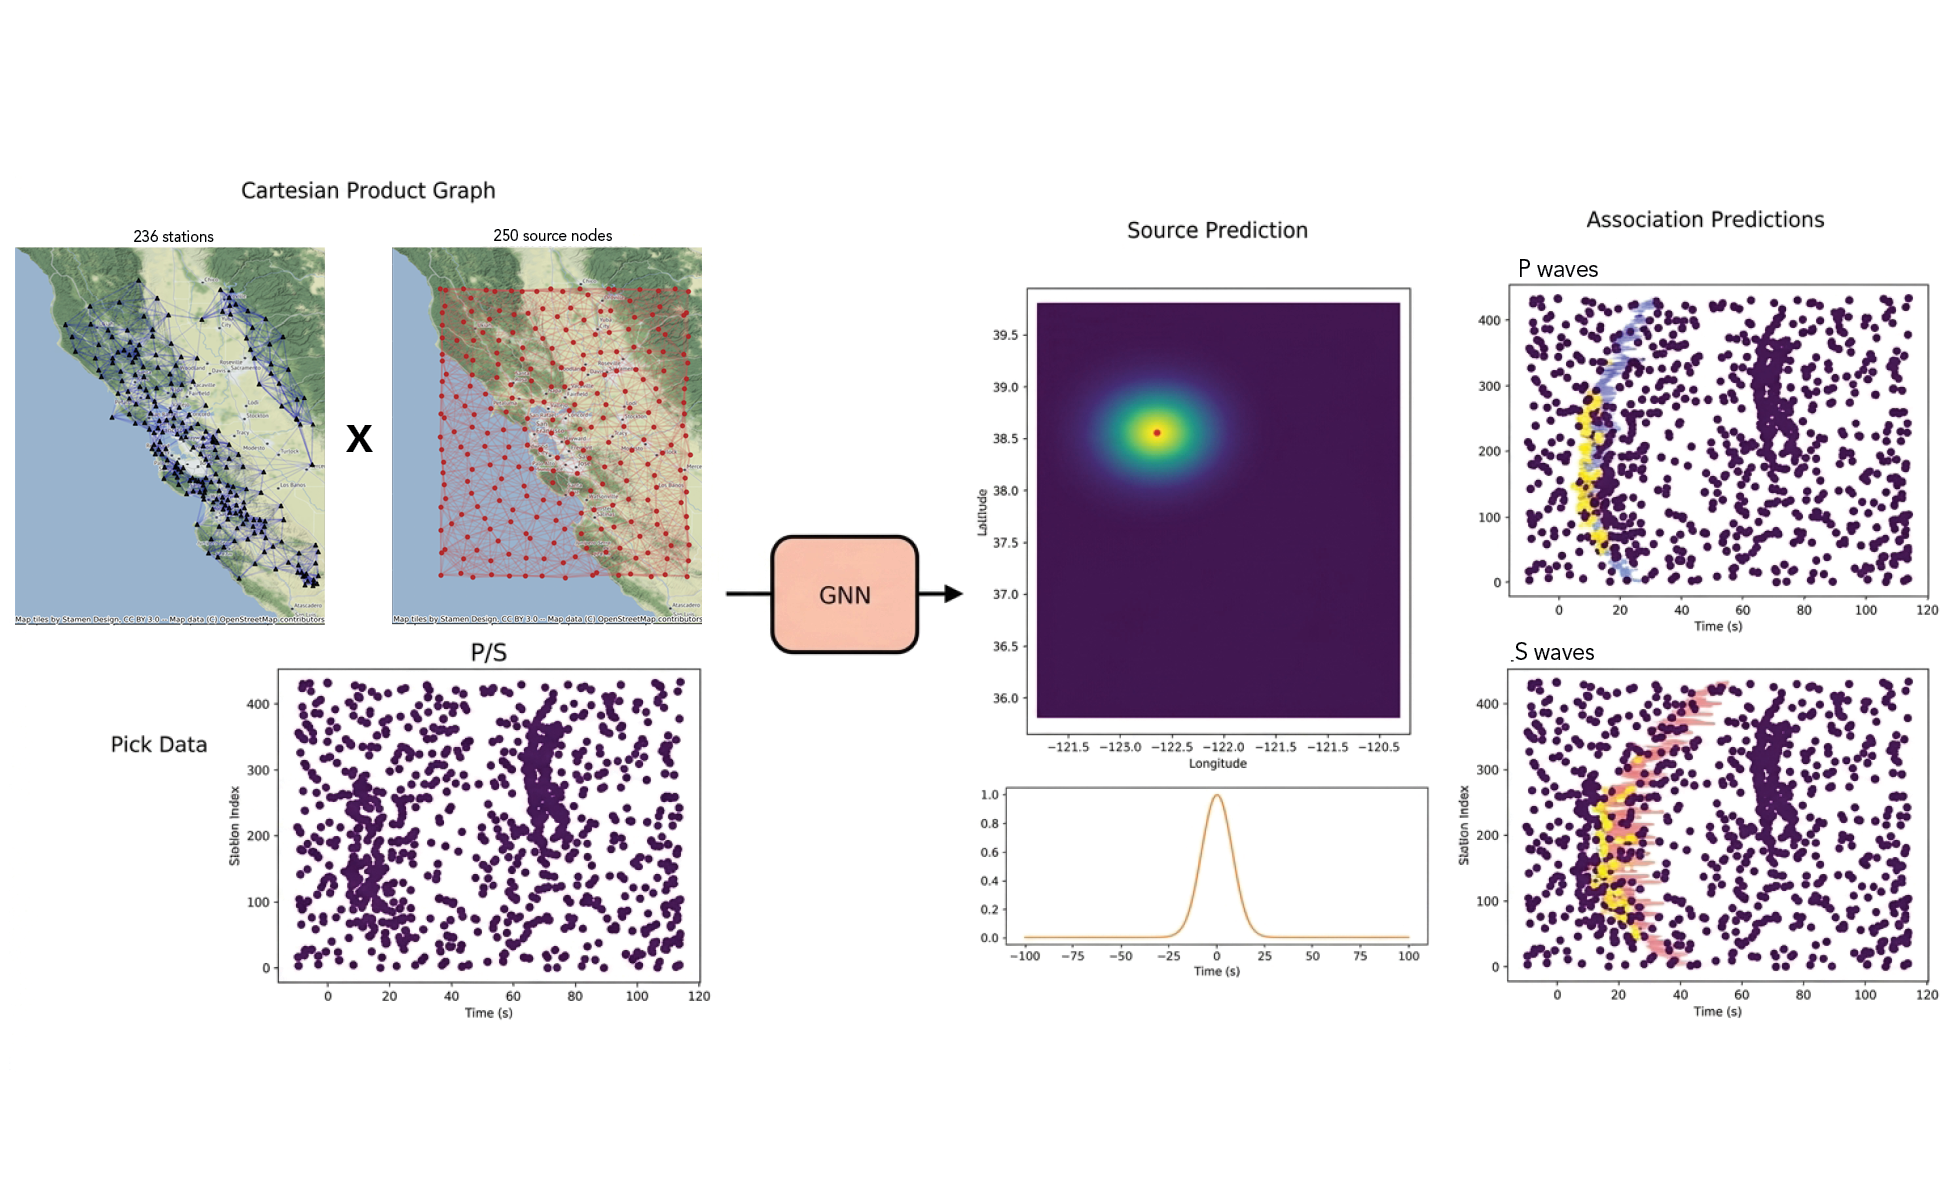
Graphs are mathematical structures made of nodes (points) connected by edges (lines). In McBrearty's model, GENIE builds two distinct graphs. The first is a station (node) graph that connects neighboring seismic sensors. The second is a spatial (source) graph, representing possible earthquake source locations across a specified region of interest.
To connect these two worlds, GENIE introduces a mathematical construct that allows the neural network to evaluate all paired station-source graphs simultaneously. Then, GENIE uses custom graph convolutions to pass messages back and forth along the graph’s nodes (seismic stations) and edges (earthquake sources). The result is a detailed 4D map showing the exact location and time an earthquake likely started, while clearly matching specific P and S wave signals to that individual event.
McBrearty then evaluated how well GENIE could rediscover known earthquakes. Across 500 random days between 2000 and 2022, GENIE successfully re-detected 96.4% of all magnitude 1.0 and higher earthquakes cataloged by the USGS. It also achieved this high accuracy across two decades of shifting network configurations without prior knowledge of when or where those earthquakes had occurred.
The true test of GENIE’s power, however, lay in its ability to discover what traditional methods had missed.
McBrearty applied GENIE to a continuous 100-day window of seismic data from late 2017 to early 2018 in Northern California, a period that included a magnitude 4.6 earthquake along the creeping section of the San Andreas Fault.
The results were astonishing. GENIE detected four times the number of earthquakes reported in the official USGS catalog for the region. These newly discovered events were not random noise; they were microearthquakes (less than magnitude 1.5) sitting right at or below the catalog's standard magnitude threshold.
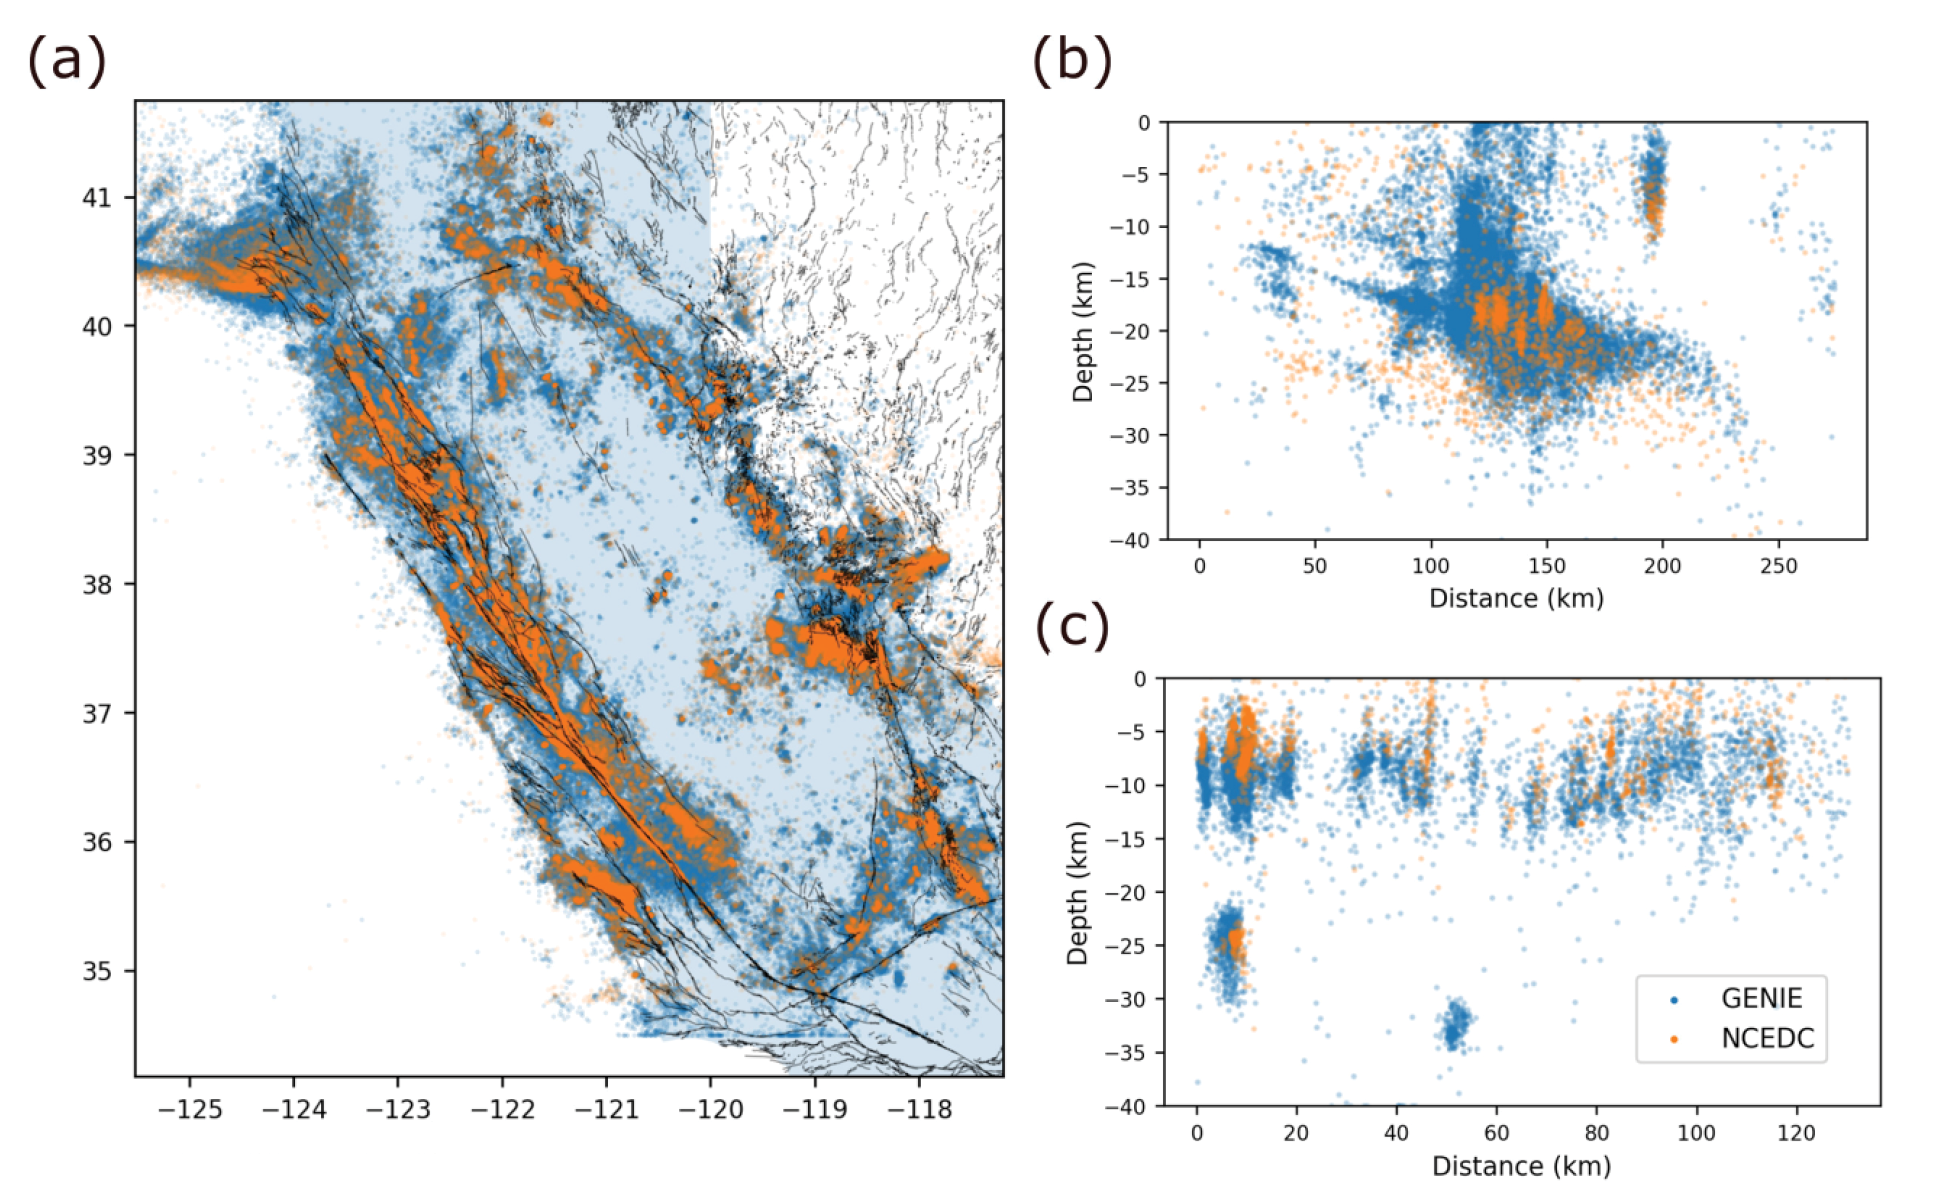
When mapped, the new detections neatly illuminated active fault structures, quarry blasts and detailed aftershock sequences following the magnitude 4.6 event. The new and improved dataset provided by GENIE turned fuzzy spatial patterns into razor-sharp images of subsurface fault zones.
"We aren't just detecting more events, we are unearthing an entirely unseen layer of subsurface dynamics that could transform our understanding of how active faults mature, creep and slip," McBrearty said.
Looking ahead, McBrearty aims to expand GENIE’s capabilities by incorporating raw waveform data directly into the graph network and expanding training parameters to capture even subtler wave attributes, such as amplitude and particle motion.
Impact on the field and future horizons
The arrival of Ian McBrearty signals an exciting new era for EEPS geophysics and earthquake science programs. GENIE offers a scalable blueprint for next-generation real-time seismic monitoring, automated early warning systems and subsurface imaging.
McBrearty’s work also represents a major shift in how observational seismology processes complex data. Beyond Northern California, his adaptable GNN framework has already been extended to investigate dense aftershock sequences, such as the devastating 2023 Turkiye earthquake doublet, as well as deep subduction zone seismicity in Chile and volcanic failure forecasting at Kilauea Volcano in Hawaii.
As McBrearty builds his research group, he plans to expand graph neural networks into broader geoscience challenges, collaborating across the department on a range of applications. By providing a fast, mathematically rigorous way to listen to the Earth's subtle vibrations, McBrearty’s research opens a clearer window into the dynamic forces shaping our planet.
References:
[1] McBrearty, I. W., Gomberg, J., Delorey, A. A., & Johnson, P. A. (2019), Earthquake Arrival Association with Backprojection and Graph Theory. Bulletin of the Seismological Society of America, 109(6), 2510–2531. https://doi.org/10.1785/0120190081
[2] Moffat, S. (Writer), & Macdonald, H. (Director), (2007, June 9), Blink (Season 3, Episode 10) [TV series episode]. In R. T. Davies (Executive Producer), Doctor Who. BBC.
[3] McBrearty, Ian W., Beroza. Gregory C., (2023), Earthquake Phase Association with Graph Neural Networks. Bulletin of the Seismological Society of America; 113 (2): 524–547. https://doi.org/10.1785/0120220182
[4] McBrearty, Ian W., (2025,. Thesis Ph.D. Stanford University. https://doi.org/10.25740/kb670ps8379